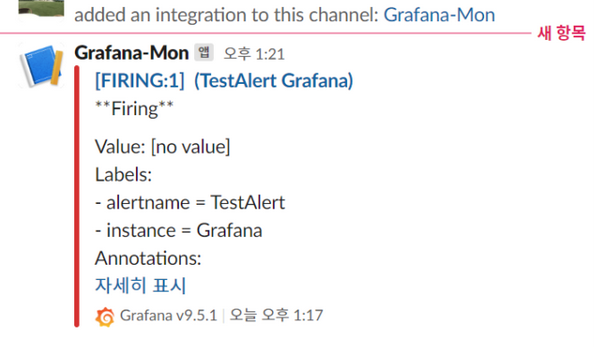
Skip to content
I Want to Go Home
  • 개인정보 처리방침
Search
I Want to Go Home
Close menu
  • 개인정보 처리방침
I Want to Go Home
Search Toggle menu

[태그:] grafana

2023@06@212023@06@23By dshanalarm, alert rule, grafana, linux, slack

Grafana Slack 알림 설정

참조 : https://afsdzvcx123.tistory.com/entry/Grafana-Alert-Slack-%EC%97%B0%EB%8F%99%ED%95%98%EA%B8%B0 https://api.slack.com/apps/  -> 로그인 필요. – “Create New APP” -> “From scratch” – “App Name” : test, “Select […]

2023@06@142023@06@16By dshangrafana, install, linux, monitoring, node_exporter, prometheus, ubuntu

Grafana-Prometheus를 사용한 server 모니터링

링크 : https://geekflare.com/prometheus-grafana-setup-for-linux/ 개요. – monitor대상서버에서 node_exporter을 통해 prometheus로 사용량정보를 전달. – grafana는 데이터를 받아 그래프 및 대시보드를 표출해주는 기능. […]

최신 글

  • Ceph reef 버전 설치하기.(with Rocky Linux 9)
  • VMWARE ESXi 암호정책 설정
  • opensource 가상화 하이퍼바이져 비교, Proxmox, XCP-ng, Hyper-V 2019
  • Windows에서 Nvidia GPU/AI Card 드라이버 모드 변경
  • Windows Server 에서 TEAM 구성 및 Hyper-V에서 이중화된 NIC 사용.

보관함

  • 2025년 7월
  • 2025년 6월
  • 2025년 5월
  • 2025년 4월
  • 2025년 3월
  • 2025년 2월
  • 2024년 10월
  • 2024년 8월
  • 2024년 7월
  • 2024년 4월
  • 2024년 1월
  • 2023년 8월
  • 2023년 7월
  • 2023년 6월

Tag

3PAR 256color alarm c7000 Certificate config degraded e-fuse esx grafana hpe hpux hyper-v install internet k8s linux mariadb monitoring NAT network ntp password podman putty redhat root SAN slack Storage switch throuble-shooting timedatectl timesyncd.conf ubuntu update vcenter vcsa virtual vmware window wordpress yum zabbix 가상화

blog. server. tools. hardware. linux. hpux. trougble shooting. aws.

© 2025 I Want to Go Home. Proudly powered by Sydney
Back to top