Zabbix Proxy 구성
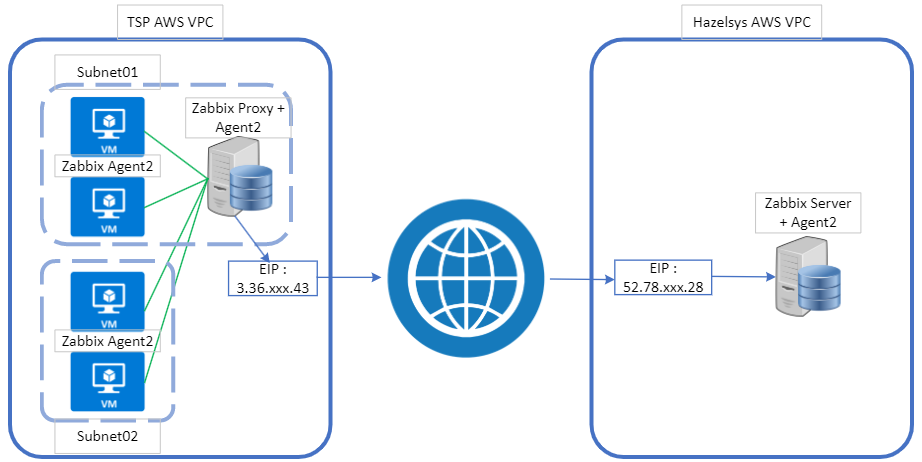
**Zabbix 의 경우 agent-server 통신이 가능해야 모니터링이 가능. 그런데 내부 사설IP의 경우 NAT를 통해 인터넷은 가능하나 특정포트 Listen으로 여는 것은 힘듬. 또한 모든 agent들이 인터넷을 […]
**Zabbix 의 경우 agent-server 통신이 가능해야 모니터링이 가능. 그런데 내부 사설IP의 경우 NAT를 통해 인터넷은 가능하나 특정포트 Listen으로 여는 것은 힘듬. 또한 모든 agent들이 인터넷을 […]

링크 : https://geekflare.com/prometheus-grafana-setup-for-linux/ 개요. – monitor대상서버에서 node_exporter을 통해 prometheus로 사용량정보를 전달. – grafana는 데이터를 받아 그래프 및 대시보드를 표출해주는 기능. Prometheus는 node_exporter을 통해 사용량정보를 전달받아 […]

링크 : https://www.zabbix.com/download?zabbix=5.0&os_distribution=centos&os_version=7&components=server_frontend_agent&db=mysql&ws=apache Centos 7의 경우 zabbix 5버전에서 서버/프론트엔드 설치가능. 버전에 맞는 repo 다운로드 및 설치 # wget –no-check-certificate https://repo.zabbix.com/zabbix/5.0/rhel/7/x86_64/zabbix-release-5.0-1.el7.noarch.rpm # rpm -Uvh zabbix-release-5.0-1.el7.noarch.rpm # […]